Team Competition — How to Make and Use a Wind Plot
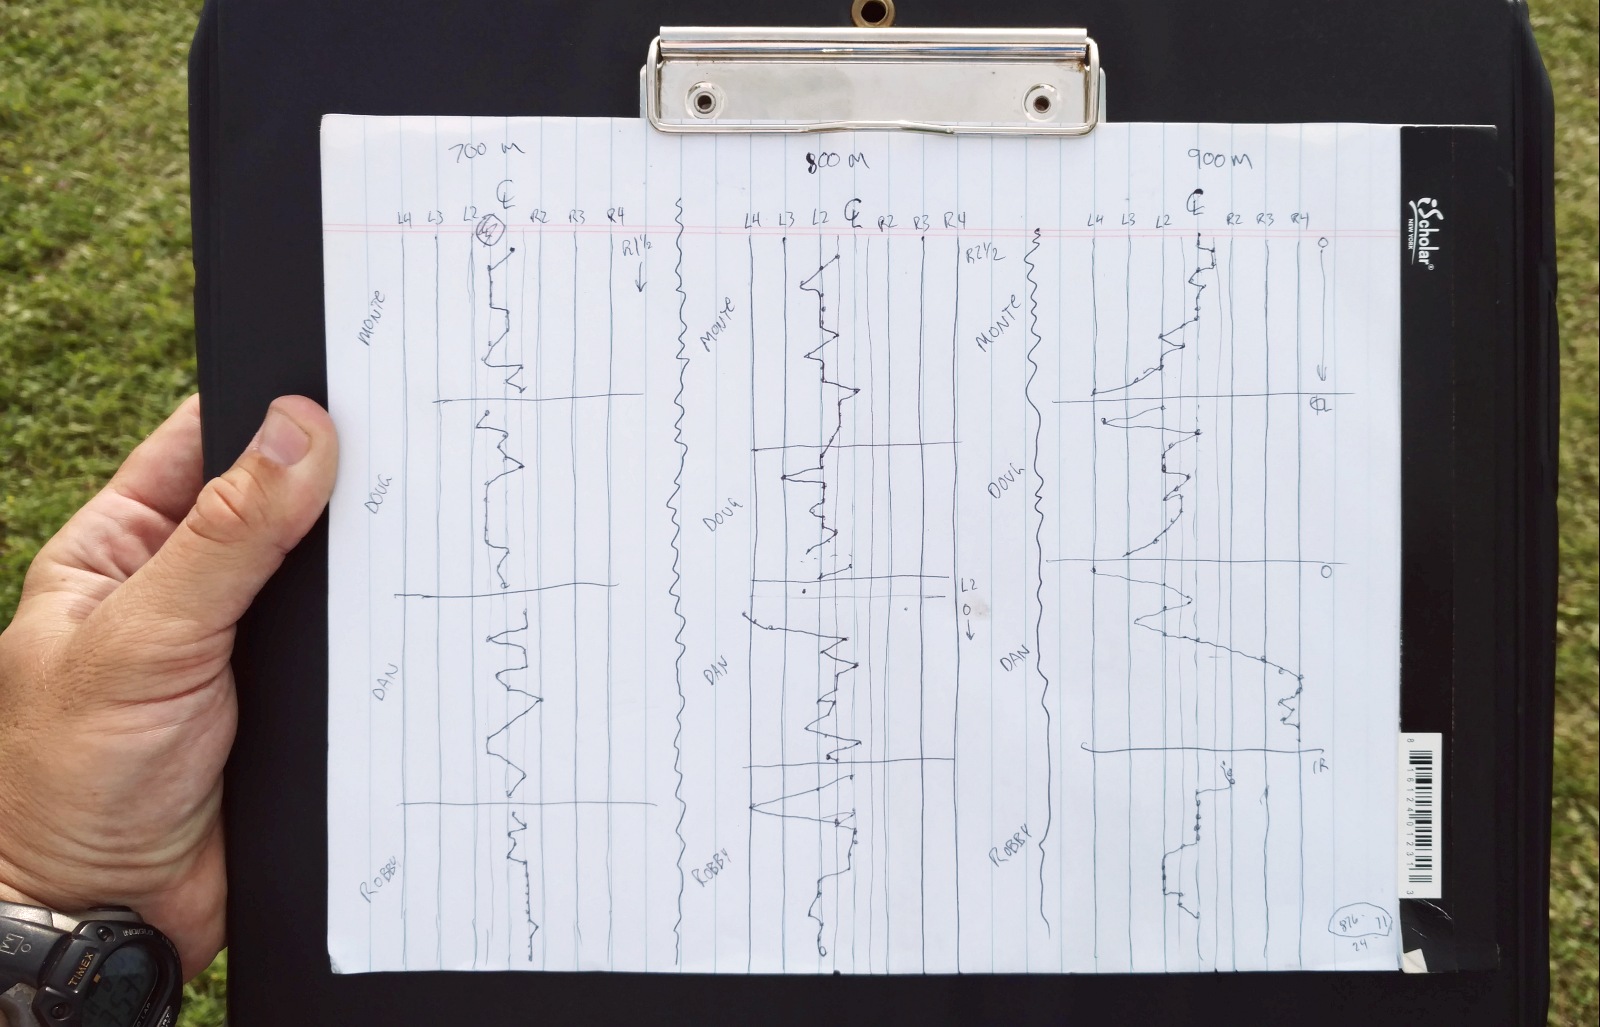
CLICK HERE to see full-screen version of Wind Plot.
Team shooting is very different than individual competition. Typically a team coach makes the wind calls for the shooters. In some cases (where the rules allow), the wind coach even dials elevation and windage changes for the active shooter. For the wind coach to do his job effectively, he must follow the changes in the wind and determine what the correct wind call should have been for each shot. (In other words — what was the “right call”)
Bryan Litz, founder of Applied Ballistics and Past USA F-TR National Champion, served as wind coach for the winning 4-man F-TR Team at the 2017 Canadian F-Class Championships, which preceded the F-Class World Championships also held in Canada. Here Bryan explains how he has used a Wind Plot to make better wind calls, helping his team-mates maximize their scores.

Wind Plot Methodology by Bryan Litz
The wind plot I use is a running history of what the correct wind call was for every shot fired. The more you shoot, the more history you have in a condition, and I find that very useful information. This kind of plot IS NOT showing where the bullet hit, and is NOT showing what you held. It’s showing what you should have held to center each shot. IMO, this is the most valuable information to have when guessing where to hold next for each shot. Here are some key points:
1. I always look for blocks of stable conditions to shoot in and wait out the rest.
2. If the wind plot shows drastic changes, either I’m not picking the right time to shoot or it’s just a really unstable wind condition.
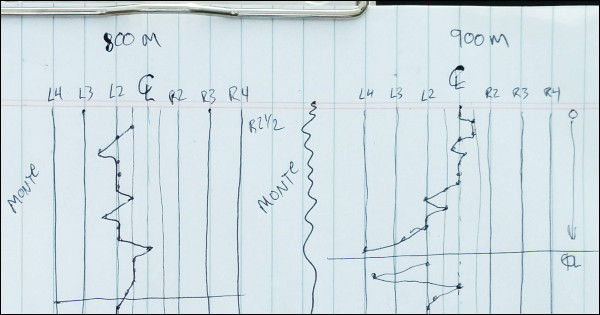
3. When you see many shots using the same hold (e.g. Robby’s 700m and 900m strings on plot), it can indicate very fast shooting and fast pit service.
Q. What are the numbers and Markings on this Wind Plot?
Litz: The wind plot represents the rings on the target. Left 2 for example, is the 5 line on the international target, while Left 2 is the 10 line on the USA target. F-Class shooters and coaches talk about wind holds in relation to these rings. A Left 2 hold isn’t left 2 MOA or 2 MILS, it’s the second ring from center. The vertical lines on the plot represent the rings going out from center, 4 or 5 in each direction. A left or right 5 hold is edge of black on the int’l target.
Q: What Does this Specific Plot Reveal?
Litz: Looking at the plot, from left to right is 700m, 800m, and 900m that we shot progressively through the day. Top to bottom shows each shooter in sequence (shooters names are shown by their blocks). To the right I note what was on the gun for that shooter, and note when it changes. Often times we run the same wind on the gun for several shooters but if it changes, I note what the new windage is and continue on. For example if we’re settled into a condition where we’re shooting Vs with a right 3 hold, I might adjust the scope 1 MOA right because a right 3 hold is equal to 1 MOA. So we can move the scope and start shooting with a center hold.
Q. Are you Plotting Where the Bullet Hits?
Litz: Not exactly. This kind of plot IS NOT specifically showing where the bullet hit, and IS NOT showing what the shooter held. It’s showing what the shooter should have held to center each shot. IMO, this is the most valuable information to have when guessing where to hold next for each shot.
On each shot, the shooter or coach takes a guess about where to hold, and fires the shot. If the bullet hits the center, you plot the point right where you held because it was the correct hold. However, if you miss the call, you plot what hold was required to put that shot in the center. For example if you shoot a right 3 and hit where you held, the correct call would have been “center”. In this way, you’re building a history of what you should have done, which may or may not be what you actually did. This shows you the trends, and brackets which can be used to make future decisions.
Q: Is this Type of Wind Plot Something New?
Litz: I didn’t invent this method, it’s been around a long time. Vertical can be plotted the same way. In team matches, we have a plotter who is advising on elevation trends and suggesting corrections. But, as wind coach, my job is the horizontal so I only keep the wind plot. I have learned lots of strategies from my coaches Emil Praslick and Steve Hardin.
There are many ways to plot and many standard work sheets for this. They’re all tools and the key is to find something that works for you in different situations. I don’t keep a plot when I am personally behind the trigger string firing because I lose more points when I take the time to do it vs. just shooting fast. When pair firing or coaching, I can keep the wind plot without compromising the shooting.

Here Team Australia used plots and communication gear linking coaches. This helped the Aussies win the 2013 F-Open Team World Championship held at Raton, NM.
Know Your Goal — Keep It Simple
Know your goal of plotting. The simplest plot is where you write the shot number where it hit on a target face. This kind of plotting is useful for evaluating shooter performance because it shows how big the group is (in particular the vertical dispersion). However keeping a plot like this does little to help you figure out the wind. It just shows you what shots you messed up on. It does nothing to help you find the center. [Editor: That’s a whole different matter with many variables.] The wind plot I use is a running history of what the correct wind call was for every shot fired. The more you shoot, the more history you have in a condition, and I find that very useful information.